 Hide Table of Contents
 Tutorials
About the API
Work with the API
Graphics and feature layers
Popups and Info Windows
Mobile
ArcGIS Server Services
References
What's New archive
Tutorials
About the API
Work with the API
Graphics and feature layers
Popups and Info Windows
Mobile
ArcGIS Server Services
References
What's New archive
Better vector maps with new rendering functionality
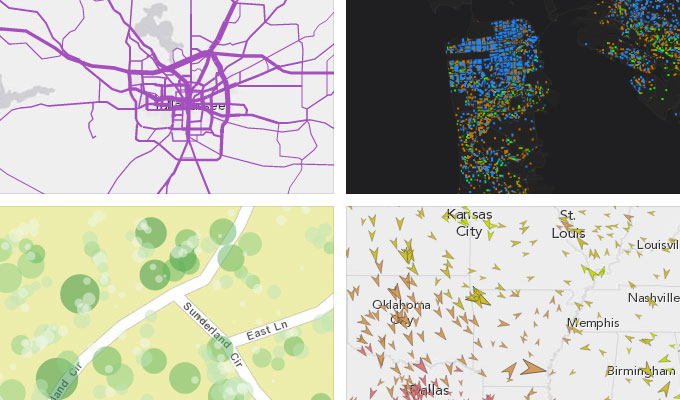
Easily create powerful visualizations with new and enhanced renderers for Feature Layers. More information is available in the Data Visualization Techniques help topic.
- Rotation: Attribute driven rotation on point Feature Layers.
- Symbol Scaling: Scale the size of the symbol based on the attribute data. The symbols can be sized according to real world distances, sized exactly proportional with the data, or proportionally mapped to a discrete range of symbol sizes.
- Dot Density Renderer: Easily create dot density visualizations. A dot density renderer can be used to visualize variation in spatial density of discrete geographical phenomenon. Dot density renderers are a beta feature at this release and the API for them is subject to change at a future release.
- Scale Dependent Renderer: Define a set of renderers to use depending on a map's scale or zoom level for a given Feature Layer.
New map widgets to simplify common tasks
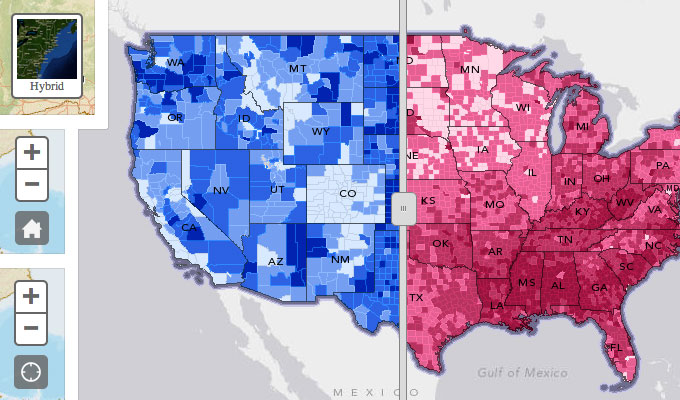
Four new map widgets to streamline adding common functionality to your applications. They are:
- Basemap toggle: switch between two basemaps from ArcGIS.com.
- Home button: simple button under the map's zoom controls to return to the map's initial view.
- Locate button: use the browser's geolocation capability to zoom to the location of a user.
- Swipe: add a draggable control to quickly compare various map layers.
Analysis widgets
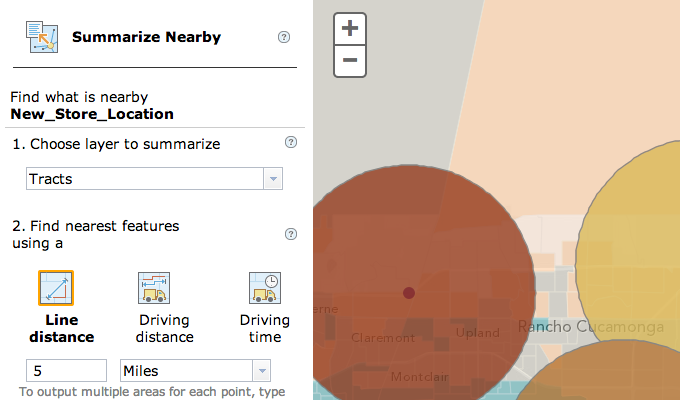
Analysis Widgets provide access to the ArcGIS Spatial Analysis Service, which allows you to perform common spatial analyses on your hosted data, via the ArcGIS API for JavaScript. The screen shot above shows part of the Summarize Nearby widget. Please refer to the Working with Analysis Widgets topic for more information on getting started with these widgets.
General map enhancements
Several small enhancements were made to the map control to improve user experience.
- At max zoom level, the "+" button is grayed out to indicate it is not possible to zoom in further
- At min zoom level, the "–" button is grayed out to indicate it is not possible to zoom out further
- When the slider is horizontal, "–" now appears on the left
- Both "+" and "–" have a :hover state to indicate they are click-able
- Attribution widget now has a semi-transparent background so that attribution info is easier to read
- New map option: optimizePanAnimation. When true, and the map's view is moved more than twice the width of the current extent (using centerAt or setExtent, for instance), the map will immediately go to that location. This reduces the number of requests sent to tiled services as it only loads tiles that intersect the new view of the map instead of requesting all tiles between the previous view and the new view.
New data-* attributes on SVG-based features
Two new constructor options for GraphicsLayer and FeatureLayer: styling and dataAttributes as well as a new property named surfaceType. The primary purpose of these additions is to easily enable styling of SVG-based vector features using CSS. Refer to the Styling features with CSS topic for more information. Printing is not supported for layers that are styled via CSS.
Client-side labeling
Beta feature: new esri/layers/LabelLayer module for cilent-side labeling. This functionality is experimental and subject to change in future releases. Refer to the client-side labeling tutorial for more information on how to use the LabelLayer class.
All Layers now have a refreshInterval property
This property can be used to refresh the layer in the map at a particular time interval. This is useful for layers whose data is updated at regularly (current radar imagery or moving vehicles).
Geocoder and Directions widget changes
When using the ArcGIS Online Geocoding Service (the default) with the Geocoder widget, we recommend setting autoComplete to true when creating the widget because the underlying service has improved support for partial queries. Additionally, at this release, the Directions widget's addStop, addStops, updateStop and updateStops methods do not work when passing a point as the first argument. Passing a string as the first argument to these methods still works. This will be corrected in the next release (3.8).
Stream layer change
New update event that provides access to graphics after they have been updated.
New samples
- Class breaks renderer with proportional symbols and rotation
- Dot-density renderer
- Dot-density renderer with multiple classes
- Graduated symbols for polygons
- Proportional symbols for points
- Proportional symbols for lines
- Proportional symbols with rotation
- Renderer with a function
- Scale-dependent renderer
- Basemap toggle
- Home button
- Layer swipe
- Locate button
- Label layer
- Hotspot Analysis
- SVG + CSS: class breaks renderer
- SVG + CSS: graduated symbols
- SVG + CSS: animate feature change with CSS transitions
Enhancements and bug fixes
- NIM094798: Show attribution for the world imagery (satellite basemap) from ArcGIS.com in the map's attribution widget.
- NIM094800: Unable to use setSize() or setAngle() with SimpleMarkerSymbols that use SVG paths.
- NIM094801: Add useCors property to esri/config.defaults.io to specify whether or not to use CORS when making request.
- NIM094802: Support protocol-relative URLs with esri/request.
- NIM094803: "basemap-change" event does not fire in IE8.
- NIM094804: Create an instance of esri/geometry/Polygon using an array of coordinates (instead of a full JSON object).
- NIM094805: Create an instance of esri/geometry/Polyline using an array of coordinates (instead of a full JSON object).
- NIM094806: Support for web tiled layers with the esri/dijit/BasemapGallery widget.
- NIM094973: esri/arcgis/utils.createMap shows the map after basemap is loaded instead of waiting for basemap and all operational layers to load before showing the map.
- NIM095054: Print task and print widget should support marker symbols that use SVG paths in browsers that support canvas.
Dojo
Version 3.7 of the ArcGIS API for JavaScript uses Dojo 1.9.1 as well as version 0.3.4 of dgrid, 0.3.1 of put-selector and 0.0.5 of xstyle.