 Hide Table of Contents
 Tutorials
About the API
Work with the API
Graphics and feature layers
Popups and Info Windows
Mobile
ArcGIS Server Services
References
What's New archive
Tutorials
About the API
Work with the API
Graphics and feature layers
Popups and Info Windows
Mobile
ArcGIS Server Services
References
What's New archive
Shorter reference URLs
This is important if you're upgrading from earlier versions!
To update your code for version 3.11 references, replace the following URLs accordingly:
/3.10/js/dojo/ should now read /3.11/ (note the dropped "/js/dojo") and /3.10/js/esri/ should now read /3.11/esri/ (note the dropped "/js") .
An example of this is shown below
<link rel="stylesheet" href="https://js.arcgis.com/3.11/dijit/themes/claro/claro.css">
<link rel="stylesheet" href="https://js.arcgis.com/3.11/esri/css/esri.css">
SDK improvements
- New updated SDK homepage.
- More sandbox supported samples.
- Tutorials are now listed under Guide tab.
- More deep links inside of documentation support better navigation.
New attribute driven data visualization using opacityInfo
Developers will now have additional ways to improve their data visualization techniques when displaying information in
their maps when using opacityInfo with
Renderers.
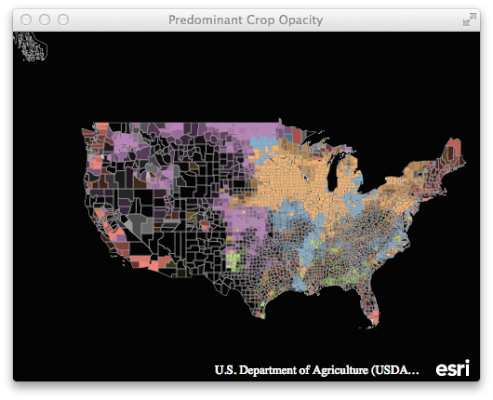
renderer.setOpacityInfo({
  field: "M086_07",
  stops: [
    { value: 10, opacity: 0   },  // -1 stddev,     transparent
    { value: 39, opacity: 0.5 },  // average value, 50% transparent
    { value: 68, opacity: 1   }   // +1 stddev,     completely opaque
  ]
});
For more information, check out the blog series on data visualization techniques as well as the samples listed under the
Renderers section in the API help.
- Data Visualization with ArcGIS API for JavaScript
- Data Visualization with ArcGIS API for JavaScript: Show Data by Unique Value
- Data Visualization with ArcGIS API for JavaScript: Enhancement Options
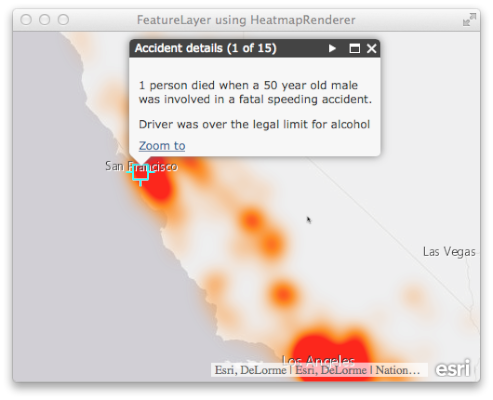
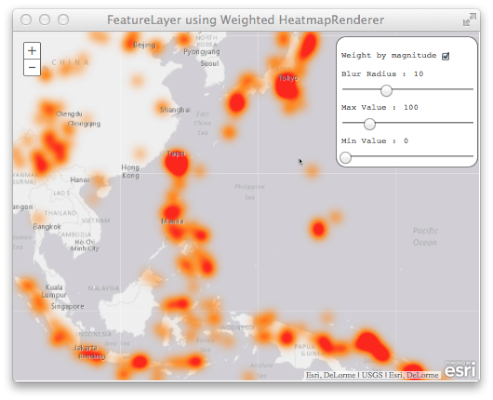
New HeatmapRenderer for FeatureLayer (beta)
FeatureLayer has a new renderer at this release. The HeatmapRenderer
creates a surface using a standard Gaussian blur algorithm
used in data visualization for illustrating areas of concentration within datasets.
The HeatmapRenderer will only work in modern browsers (not IE9 and below).
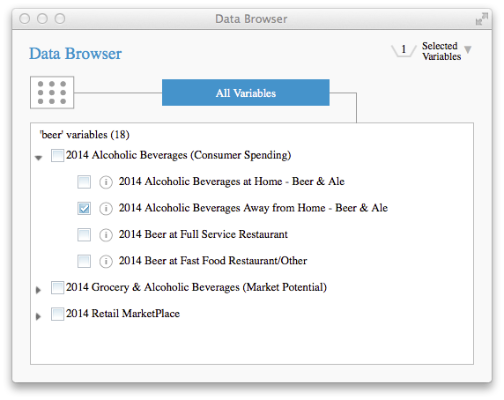
Discovering demographic data and GeoEnrichment variables with DataBrowser
Developers building applications enriched with
Geoenrichment data, can now
leverage the DataBrowser
widget. This widget simplifies the process of discovering Geoenrichment variables for enhancing data in applications
or
gathering variables for generating reports.
Improvements when using web maps
At this release a new property editable
in options on method createMap was introduced. When supporting non-editing workflows,
this will override layers that would have otherwise been editable and allow the FeatureLayers
in a web map to load using generalized geometry instead of loading detailed geometries for editing purposes.
Developers consuming web maps will be able to leverage performance enhancements at this release
due to internal optimizations which intelligently load modules based upon a web map configuration
when using the module esri/arcgis/utils, and the createMap method when hydrating
web maps.
Faster application loading
Many performance enhancements were introduced into the standard and compact builds at this release. These changes will allow users of the compact and standard build to leverage the most frequently used modules resulting in overall performance when loading the compact and standard versions of the JavaScript API.
For best performance with web map, please re-save any existing web maps. To do this, simply open the web map in the Viewer, then click "Save". This will update them to the latest version which will benefit the loading of your applications.
Web Optimizer changes and enhancements
- More optimizations to minimize download size when "Only include built layer files and resources" is checked.
- New advanced option to select locales for custom builds.
- Users now receive links to builds in email notifications.
- Additional help topics of Using a custom build and Accessing the build report.
Measurement widget enhancements
New developer events and methods to support interacting with geometries during the life cycle of the Measurement
widget, accessing the current tool, and current units. Fixed issues for developers when using the
Measurement
widget in applications and services containing coordinate systems other than WGS84 and Web Mercator.
Driving direction enhancements
The directions print window includes an overview map of the route as long as you either use
the ArcGIS Online Route service or specify a
printTaskUrl.
Labelling improvements
The Map class has a new constructor option showLabels
to indicate whether to automatically display labels. If true, any feature layer added to the map will automatically
be labelled based on the feature layer's labelingInfo and the layer's own showLabels status.
The LabelLayer has been improved with to work with domain values,
better support for field names containing non-ASCII characters,
better label placements,
support label placements using "always-horizontal" style,
and to work better with time-aware data.
Developer enhancements for dealing with projecting features
New methods for developers to easily (a) check if client-side projection is possible (canProject) and (b) project geometries (without using geometry service).
var pt = Point(0, 0), // a geographic point.
    result;
if (webMercatorUtils.canProject(pt, map)) {
    // Returns true if the 'source' can be projected to 'target' by the project() function, or if source and target is the same spatialReference.
    result = webMercatorUtils.project(pt, map);
}
else{
    // cannot project client-side, use GeometryService
}
Enhancements to InfoTemplate custom functions
Developers now have the ability to use custom format functions within InfoTemplate to use options like the built-in format functions.
This can be useful when you are reusing a formatting function with different options.
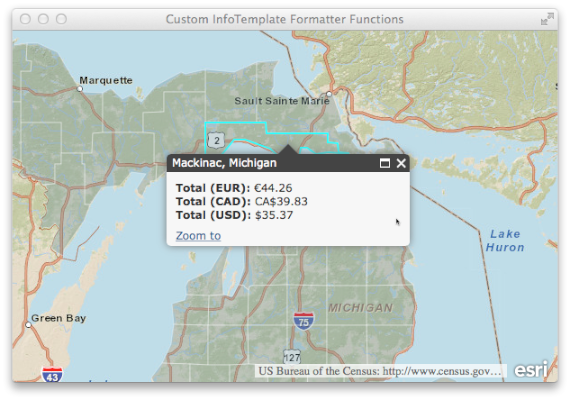
CustomFormat = function (value, key, data, options){
  if(options.currency === "CAD"){
    return dojoCurrency.format(value * 1.1260, options);
  }
  else if(options.currency === "EUR"){
    return dojoCurrency.format(value * 1.25140, options);
  }
  else{
    return dojoCurrency.format(value, options);
  }
}

infoTemplate.setTitle("${NAME}, ${STATE_NAME}");
infoTemplate.setContent("<b>Total (EUR): </b>${AVG_SALE97:CustomFormat( currency: 'EUR', places: '2')}<br/>" +
  "<b>Total (CAD): </b>${AVG_SALE97:CustomFormat( currency: 'CAD', places: '2')}<br/> " +
  "<b>Total (USD): </b>${AVG_SALE97:CustomFormat( currency: 'USD', places: '2')}<br/>");
API enhancements
- New class
HeatmapRenderer(beta). - New class
DataBrowser. - New method fromExtent on
Polygonclass. - New property clearOnTrackingStop
on
LocateButtonclass. - New constructor option definitionExpression
on
FeatureLayerclass. - New properties supportsAttachmentsByUploadId and
supportsCalculate
on
FeatureLayerclass. - New constructor option showLabels
on
FeatureLayerclass. - New property showLabels
on
FeatureLayerclass. - New method setShowLabels
on
FeatureLayerclass. - New event
show-labels-changeonFeatureLayerclass. - New constructor option showLabels
on
Mapclass. - New property opacityInfo on
Rendererclass. - New methods setOpacityInfo and
getOpacityInfo on
Rendererclass. - New methods getTool and
getUnit on
Measurementclass. - New events
measure-startandmeasureonMeasurementclass. - Updated event
measure-endonMeasurement. - New events
tool-changeandunit-changeonMeasurementclass. - New constructor option highlightLocation
on
Geocoderclass. - New constructor options symbol,
graphicsLayer and
geocoders on
Geocoderclass. - New property highlightLocation,
symbol and
graphicsLayer on
Geocoderclass. - New method suggestLocations on
Locatorclass. - New event suggest-locations-complete
on
Locatorclass. - New properties
categories and
countryCode
on
Locatorclass. The countryCode property only applies to the Esri global geocoder. [ENH-000081715] - New property outScale
on
PrintTemplateclass to support printing at a specific scale. - New property returnDistinctValues
on
Queryclass. [NIM091580] - New constructor options
maximumTrackPoint and
geometryDefinition
on
StreamLayerclass. - Updated methods setDefinitionExpression and
getDefinitionExpression
on
StreamLayerclass. - New methods setMaximumTrackPoints ,
getGeometryDefinition and
setGeometryDefinition
on
StreamLayerclass. - New events filter-change,
attempt-reconnect and
connection-error
on
StreamLayerclass. - New constructor options
geometryTaskUrl and
printTaskUrl
on
Directionsclass. - New property editable in
options on method
createMap - New methods
canProject and
project
on
webMercatorUtilsclass. - All events include a target property.
Bug fixes
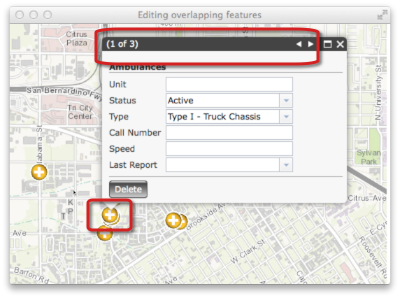
- NIM100031: Users now have a consistent user experience for Popups containing multiple features read-only and edit.
- BUG-000080930: Popup next/previous buttons should switch for Right-To-Left.
- NIM100127: Fixed issue where inline style for font size was applied using Internet Explorer.
- NIM103917: The InfoTemplate
zoomTofunction now works with a single point in a multipoint feature class. - NIM103178: Fixed an issue where printing ArcGISDynamicMapServiceLayers with layer definitions on sub layers printed all of these layers were printed regardless of whether their visibility was set to false.
- NIM101737: The Draw toolbar extent geometry now displays in exported web map.
- NIM103247: Fixed issue where the zoom rectangle would not display properly when using Internet Explorer.
- NIM103715: Fixed an issue where Esri demographic layers show a long running script message when opening a popup using IE8.
- NIM102529: Esri logo in samples now opens the respective URL in Internet Explorer.
- NIM095050: Scale visibility of KML layer is now honored.
- NIM104028: Fixed an issue where a labeled feature displayed the coded domain value and not the description.
- NIM104292: Fixed an issue where the the measurement widget measure-end event fired before the polygon finished.
- NIM103917: InfoTemplate zoomTo now supports single points when using a multi-point featureclass datasource.
- NIM103868: KML layer placemarks with hotspots now display in the correct location.
- NIM103312: Can now print a map containing a graphic having attributes and a Text Symbol as its symbol.
- NIM100031: Now able to work with overlapping records when editing a feature service.
- NIM104099: PrintTask now prints a map containing a WMTS layer without a specified resourceInfo parameter.
- NIM103199: Added the ability to ignore missing legend styles for WMS layers in the Legend widget.
- GeoNet-106484: UndoManager now supports On Style events. See also GeoNet discussion.
- GeoNet-423902: Class name was added for the messages div in the Legend widget to make it easier to apply css.
- Directions widget: Get Directions button didn't work on some native Android browsers.
Additional Resources on GitHub
Be certain to check out any updates to the repository on GitHub with TypeScript definitions for the JS API as well as the jshint options file used by the JS API team.
Dojo
Version 3.11 of the ArcGIS API for JavaScript was upgraded to use Dojo 1.10.0. dgrid was upgraded to version 0.3.15. put-selector version 0.3.5 and xstyle version 0.1.3 are also included.