 Hide Table of Contents
 Tutorials
About the API
Work with the API
Graphics and feature layers
Popups and Info Windows
Mobile
ArcGIS Server Services
References
What's New archive
Tutorials
About the API
Work with the API
Graphics and feature layers
Popups and Info Windows
Mobile
ArcGIS Server Services
References
What's New archive
Point Clustering
We added support for clustering point features in FeatureLayer
and CSVLayer. Clustering
is a method of aggregating point features so fewer of them display in the view. This can help reveal
potential spatial patterns present in the data that might otherwise not be immediately apparent if displaying all points with the same symbol.
For example, the image on the right clusters points based on a given amount of screen space, thus decluttering the view and providing a snapshot
of where more features are located in relation to others.
| No clustering | Clustering |
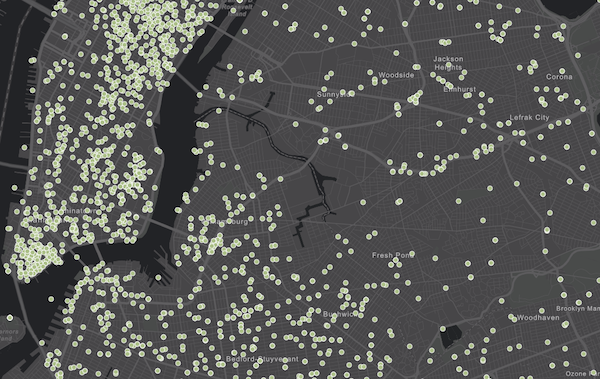 | 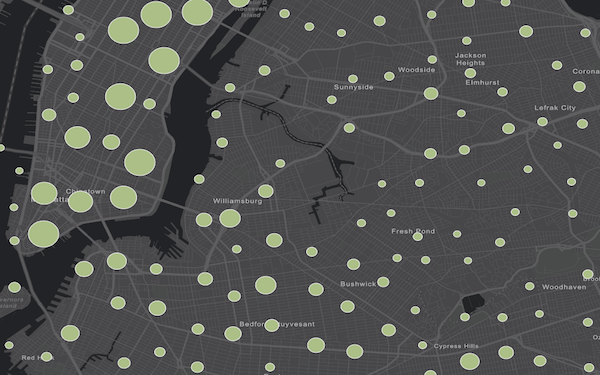 |
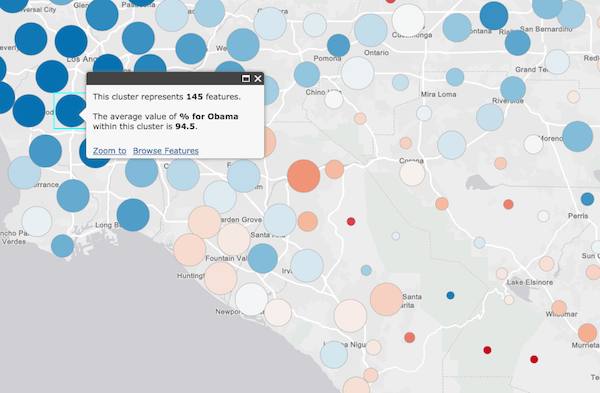
When a cluster is clicked, a popup appears, summarizing the features that comprise the cluster. Users are provided with the ability to browse individual features by clicking the Browse Features option at the bottom of the popup. This capability allows you to view popup information for individual features as well as their actual location on the map.
In the API, clustering is referred to as featureReduction. Each of the supported layer types allows the developer to set featureReduction options
in the constructor. They may also be set via the setFeatureReduction() method
of the layer.
featureLayer.setFeatureReduction({
  type: "cluster",
  clusterRadius: 60  // the pixel radius for determining which features belong in each cluster
});
Note that featureReduction is a property of the layer, not the renderer. That means that any renderer (with the exception of HeatmapRenderer),
retains its visualization properties on the layer even when clustering is enabled. If you set a renderer with a
colorInfo visual variable on a layer, for example, and enable clustering, then the clusters will
average the numeric value driving the color visualization and shade the clusters based on the average value. The popup will then
display a summary of the features based on the given renderer field. Size, opacity, and rotation visual variables are handled in the same manner.
In the case of UniqueValueRenderer, each cluster will be shaded with the color representing the predominant value among the features comprising the cluster.
The following are new samples demonstrating feature reduction:
Support for feature reduction is limited to the following scenarios:
- Point data in FeatureLayer (from service or FeatureCollection) and CSVLayer.
- The map must have a spatial reference of Web Mercator or WGS84.
- If the layer contains more than 50,000 features, then only the first 50,000 will be clustered.
- A FeatureLayer created from a service URL must point to a service that supports pagination (ArcGIS Server version 10.3.1 or higher).
- When editing is initiated with the Editor widget, then feature reduction is disabled until the Editor widget is destroyed.
- Feature reduction is disabled when the layer has one of the following renderers:
HeatmapRenderer,BlendRenderer,TemporalRenderer, orScaleDependentRenderer.
API updates and enhancements
- New constructor option
featureReductionon classFeatureLayerandCSVLayer. - New method
setFeatureReduction()on classFeatureLayerandCSVLayer. - New method
getFeatureReduction()on classFeatureLayerandCSVLayer. - New method
isFeatureReductionEnabled()on classFeatureLayerandCSVLayer. - New method
enableFeatureReduction()on classFeatureLayerandCSVLayer. - New method
disableFeatureReduction()on classFeatureLayerandCSVLayer. - New method
isFeatureReductionActive()on classFeatureLayerandCSVLayer. - New method
getAggregateGraphics()on classFeatureLayerandCSVLayer. - New method
getSingleGraphics()on classFeatureLayerandCSVLayer. - New method
isAggregate()on classGraphic. - New method
getChildGraphics()on classGraphic. - New method
clone()on classGraphic. - New property
clusterFillSymbolon classPopup. - New method
addActions()on classPopup. - New method
removeActions()on classPopup. - New method
getCurrentAnchor()on classPopup. - New method param
optionson methodPopup.setFeatures(). - New property
returnFieldNameon classIdentifyParameters. - New property
returnUnformattedValueson classIdentifyParameters. - New event
network-link-erroron classKMLLayer. - OAuthInfo's popupWindowFeatures property no longer contains a default
location. - Added a
refreshIntervalproperty to the mediaInfos object.
Bug fixes and enhancements
- BUG-000105873: Legend now displays the description instead of code when symbolizing attributes with coded domains.
- BUG-000107120: Fixed an issue where the Print widget would fail if a PictureMarkerSymbol's JSON did not include either
imageDataorurlproperties. - Fixed an issue where transparency was not honored in map service sublayers.
- Fixed an issue where a StreamLayer would disconnect from a service if a query to a corresponding feature service was cancelled.
- Fixed an issue where
WebTiledLayermissing an LOD for level 0 wouldn't display in Chrome browser. This was an issue for some tianditu.com layers.
Additional packages
Version 3.22 of the ArcGIS API for JavaScript include:
- dgrid versions
- dgrid version 1.2.1 (since version 3.22)
- dgrid version 0.3.17 (since version 3.13)
NOTE: If working with version 1.1.0, please reference the
dgrid1directory, whereas version 0.3.17 should reference thedgriddirectory. Please refer to the dgrid 0.4 Migration Guide for additional information on migrating to the newer version.
- Dojo version 1.12.2 (since version 3.21)
- dstore version 1.1.2 (since version 3.22)
- put-selector version 0.3.6 (since version 3.13)
- xstyle version 0.3.2 (since version 3.17)
Additional Resources on GitHub
Be certain to check out any updates to the repository on GitHub with TypeScript definitions for the JS API as well as the jshint options file used by the JS API team.